HUD released its July 2019 HECM Endorsement Summary Reports, our summary of which can be found here: NV Endorsement Report 2019_07. HUD’s report shows a total of 2,754 endorsements, 8% higher than June’s 2,546 units. However, the modest increase is more likely a reflection of 2 additional business days in July rather than any fundamental change in the market. Based on day count, volume is down month over month, from approximately 127 closings per day to 125. Day count is a common analytic in the forward mortgage market. Other than the fluctuation observed at year-end due to the government shutdown, endorsement volume for the last 12 months has shown disappointing stability, and that’s before factoring in interest rates falling almost 1.5% since late 2016.
It was another active month for Fairway as a wholesale originator that sells its loans to other sponsors. This month Fairway originated 98 such loans endorsed by HUD. After falling behind Liberty Home Equity Solution for two months, Finance of America Reverse once again led the companies that sponsored loans originated by another lender, with 340 loans. Liberty Home Equity Solution sponsored 143 such loans, and it was enough to drop Liberty to second place based on annual totals.
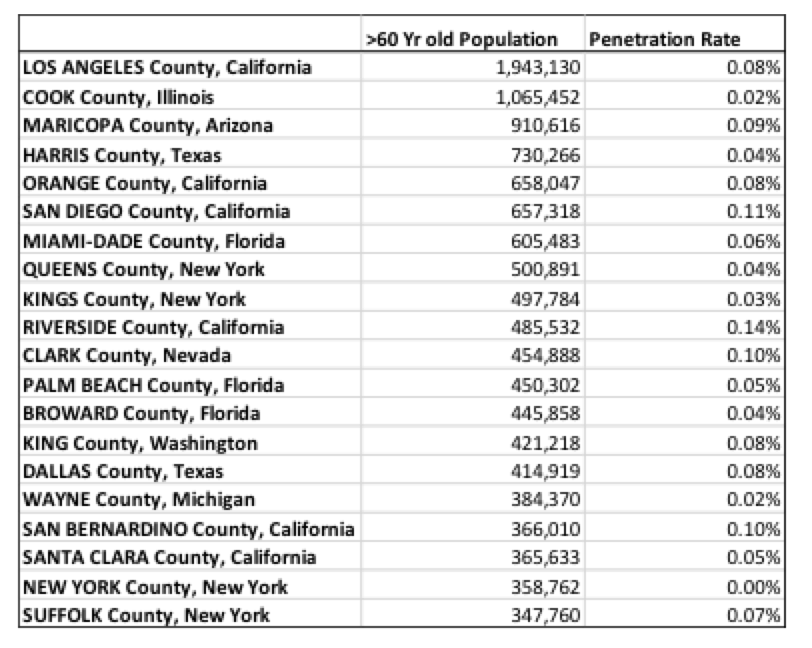
As a follow up to last month’s analysis on county-level market penetration, this month we look at the penetration rates of the counties with the largest 60+ populations (the penetration rate is based on number of endorsements from the last 12 months as a percentage of the older-than-60 population). As a reminder, the top 10 counties have penetration rates ranging from 0.17% to 0.50%. In comparison, many other counties with large number of senior citizens appear to be significantly underserved by the HECM market. The reason can be multifold. For example, New York County’s diminutive penetration level is likely caused by limitations on HECM lending backed by condo and coop properties, while the low rates in other counties likely result from regulatory and legal hurdles, and challenging local social economical dynamics such as housing prices, wealth/poverty levels, etc.


Leave a Reply